Tutorial - Page 3
Now we are ready to define the DETAIL band for this sample report. To recap, the DETAIL band performs the data retrieval from the database and inserts it in the desired location in your report. Sometimes it is a good idea to draw the sample report on a piece of paper to help you "visualize" how the report needs to look when it is generated. If you are creating report(s) for other people you definitely need to discuss with them how their report should look like, and what information it needs to extract from the database file(s).
If you haven't familiarized yourself with FRAMES you need to - click HERE to read about FRAMES.
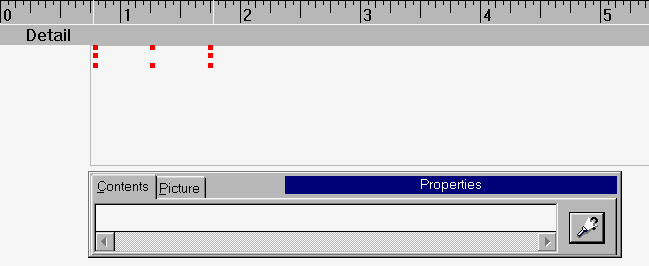
Right now the work area inside the Report Formatter is completely blank, with only the top menu and toolbar buttons visible. Click on the BAND main menu option, then select NEW, then select DETAIL from the options. Notice that the screen now has a rectangular box with red boxes at each corner and the top/bottom middle. A ruler bar is displayed to the left of the rectangular box also. The red rectangles allow you to resize the size of this report band - we'll leave it alone for now.
Now we need to add some database fields to the DETAIL band. Database fields will be placed inside of FRAMES - a FRAME tells the Report Builder engine how and what to print in the location where the FRAME is located. There are two ways of adding a FRAME to the DETAIL band - you can select from the main menu "Frame", then "Create" - an empty FRAME is automatically created inside the DETAIL band at the top left of the DETAIL band. An easier way is to place the mouse in the area where you want to print the database field, then right click the mouse to display a popup menu; select the menu option titled "New Frame", and an empty frame will be created in the exact location where the mouse was at inside the DETAIL band.
You can choose to move the empty frame to a better location right now, or wait until you define the information that will be inside the frame. To move the frame with the mouse you left click anywhere inside the frame, and while holding down the left mouse button you drag the rectangle to the desired location. You can also use the keyboard to move the frame by holding down the CTRL key, and use the arrow keys to move the frame. Here is what the screen looks like for now:

To add text to a frame you left click the mouse once inside the CONTENTS entry field in the FRAME properties box; as you type the information will be displayed inside the FRAME. If the length of the text is longer than the frame you can easily resize the frame by clicking on the right middle red box, and while holding down the left mouse button drag the box to it's new size. You will notice that the mouse cursor will change shape from an arrow to a double arrow, which is telling you that you can resize the FRAME in the directions of the arrow by left click-dragging the mouse.
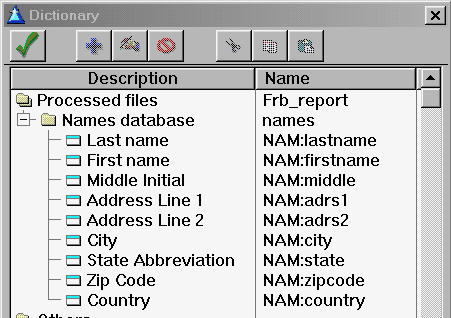
For now we are just adding the fields to the DETAIL band; left click on the button with the flashlight inside it to display the dictionary When the dictionary appears onscreen click the tree expand box directly underneath the 'Processed Files' description. A list of all database fields is displayed onscreen for you to choose from:

To select a field simply double left click on the field name description; for this example the "Last name" tree choice is double left clicked. The dictionary window will disappear, and the FRAME box is now updated:

Notice that an equal sign (=) is displayed in front of the field name (NAM:lastname) Also notice that the inside of the frame is displaying dollar signs ($). This helps you in properly resizing the frame size for this database field.
At this point the steps for adding a new frame and populating the frame are repeated for each of the remaining fields in the database. After moving the mouse to the desired location inside the DETAIL band I am right clicking the mouse, selecting "New Frame", then select the desired database field, then dragging the frame to be to the right of the last added frame. All frames will be located at the top of the DETAIL band. For the Middle Initial field I resized the frame, since it is a lot larger than it needed to be. There is not sufficient space to have all the frames at the top, so the COUNTRY field had to be left off of the report. Here is what the screen looks like:

Not too pretty, huh? We need to move the frames so they are aligned at the top for a nice looking report. The Report Builder features a very easy way of aligning frames in many different ways. You can choose to move each frame yourself using the mouse, or the keyboard, but this can be very time consuming - there is a much easier way! The first thing to do is select all the frames on an imaginary line that you want the data to be printed on. To do this you will left click the leftmost frame, the while holding down the CTRL key you will left click on each frame located on that imaginary line. After doing this to the last frame you will have multiple frames displaying the resize rectangles at each corner, but they will be blue in color.
Right click the mouse to display a popup menu - this menu will display various options to aligning multiple frames. The easiest choice is ALIGN TOP; after selecting it from the menu all the frames are now aligned in a more pleasing way:

So far we have one DETAIL band, with 8 frames containing database fields. We'll save the report right now by clicking the floppy disc button located on the toolbar. You can also save the report by clicking FILE from the main menu, then select SAVE. It is a good idea to periodically save your work as you change the report.
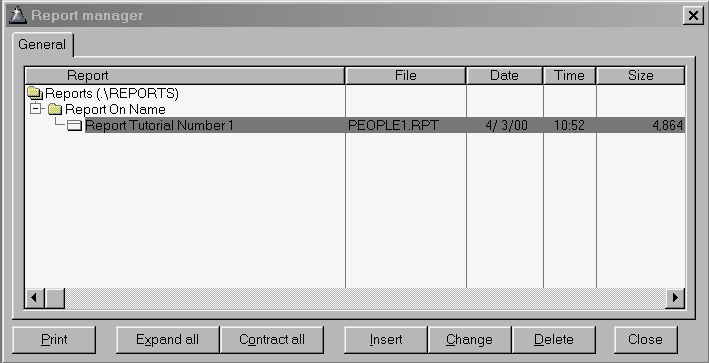
Now we need to test the report to see how it looks. Go ahead and click FILE from the main menu, then select EXIT from the pulldown menu. You will notice that the Reports Manager screen is different now:

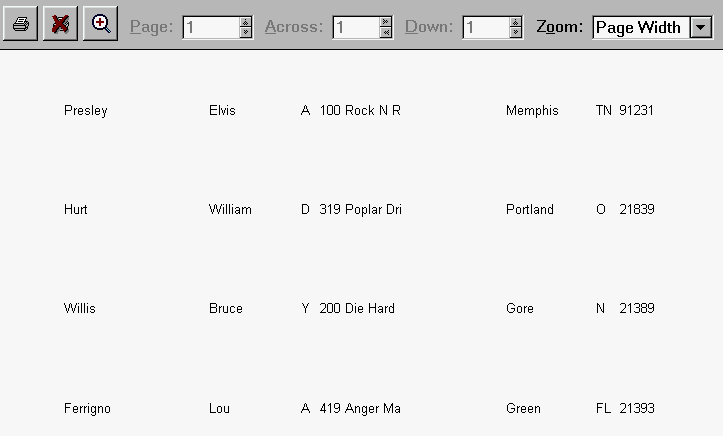
The newly created report is displayed onscreen, with the filename / date / time / size information about this report file. To print the report click the PRINT button; the report will be sent either to the screen (print preview) or to the printer, depending on how the programmer designed the application. For this example the report was generated to the screen; the database only contained 4 database records, so the output was very small:

Chances are excellent that the print preview screen will be different than the one displayed above; this screen capture is from a very simple print preview engine. The important things to notice here is the layout of the information to detect problems. Using the above information we can see these problems:
•There is too much space between each line of information - this would waste a lot of paper
•The street address field is getting chopped off (ex: 419 Anger Ma)
•The country field is missing since insufficient space existed for it on the DETAIL band
•The name fields could be formatted a lot more attractively
•There is no sorting being done on the database; would be nice if sorted on last name
One of this Report Builders most attractive features is it's flexibility - you can change ANYTHING you want to for your reports. The problems identified above with the first report are very easily fixed. We will be fixing these things in the next tutorial step.
